Durian Farming with Integrated Dashboard and Python Machine Learning Libraries
Introduction
Durian is a high-value fruit, especially in Southeast Asia, where countries like Thailand are major producers. However, durian farming requires close monitoring of various factors, such as soil moisture, temperature, and rainfall. Integrating IoT (Internet of Things) technology with machine learning can help farmers predict and optimize their farming processes for better efficiency and productivity.
This article explains how to integrate sensor data from a durian farm with machine learning libraries in Python and visualize the results on a dashboard. This setup allows farmers to make data-driven decisions to manage their farms more effectively.
System Components
1. IoT Sensors for Farming
In a durian farm, IoT sensors can be installed to monitor environmental factors such as:
- Soil moisture sensors
- Temperature sensors
- Sunlight intensity sensors
-
Rainfall measurement devices
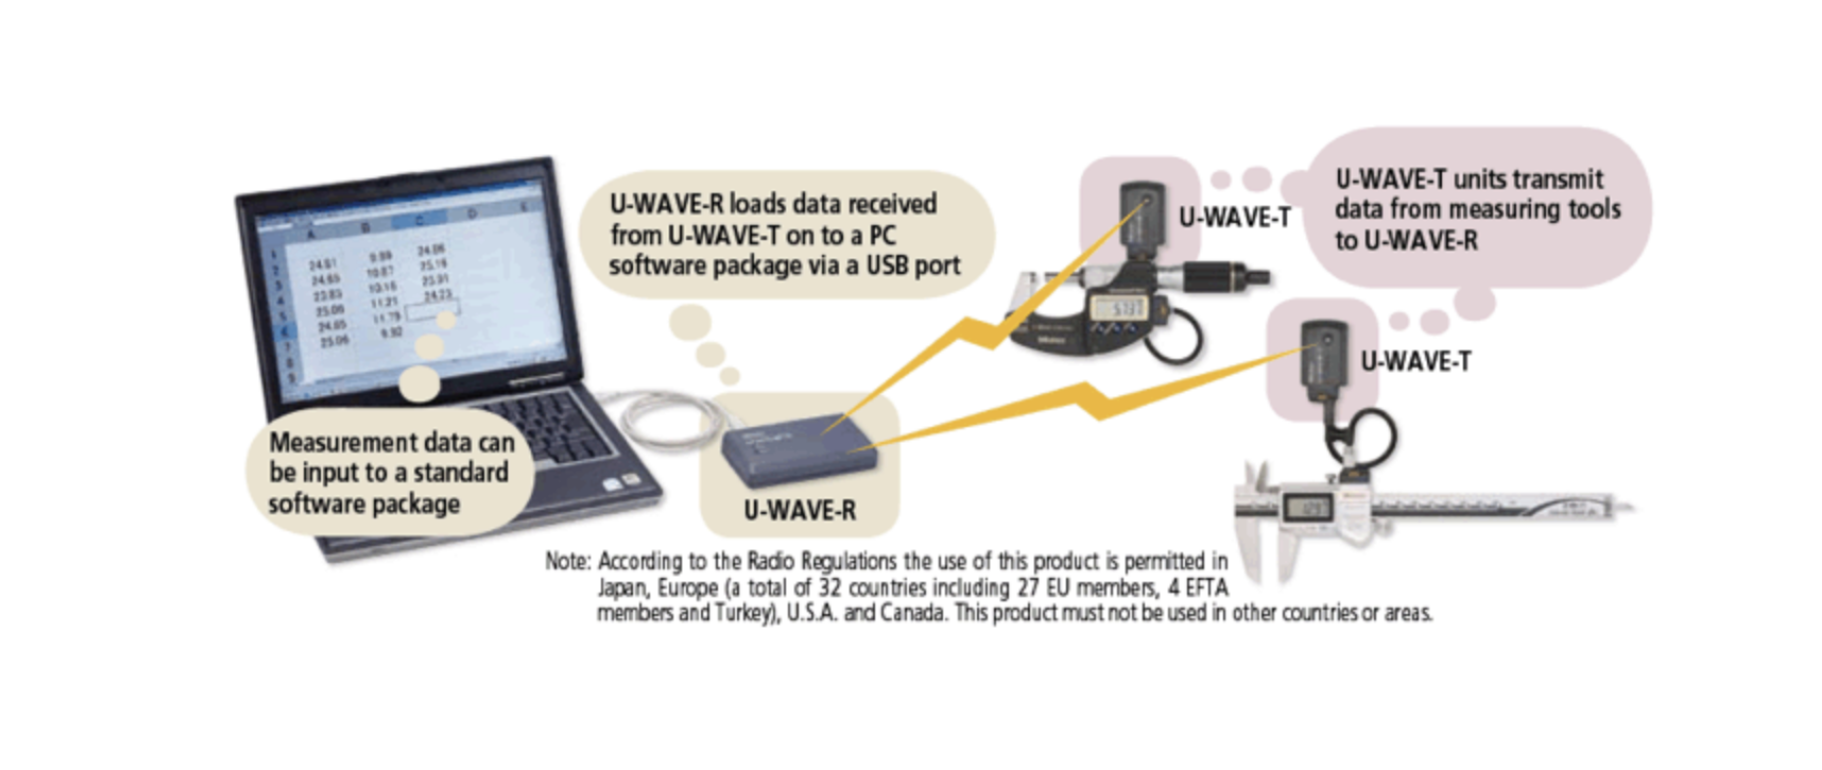
Data collected from these sensors are sent to a computer system for processing and stored in a database.
2. Using Python Machine Learning Libraries
Sensor data can be analyzed using Python machine learning libraries such as Scikit-Learn, XGBoost, or TensorFlow. These libraries enable predictions and decision-making in farm management. For example:
- Predicting when to irrigate the crops
- Detecting plant diseases from sensor data or images of leaves and durian fruits
- Analyzing trends in yield based on weather conditions
3. Dashboard for Data Visualization
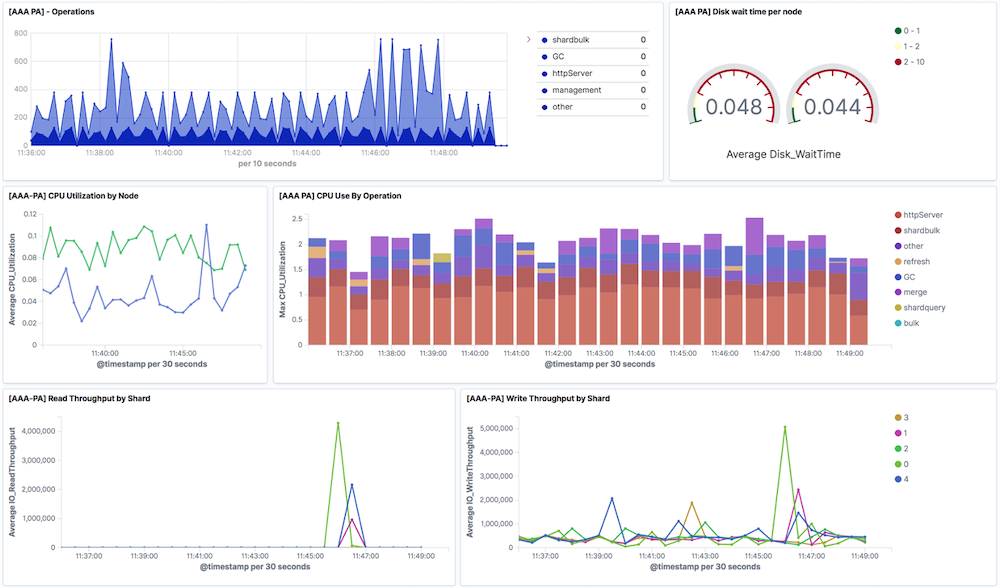
To make the data and predictions accessible to farmers, the information can be displayed on a user-friendly dashboard. Tools like Plotly Dash, Grafana, or OpenSearch Dashboards can be used to create real-time graphs and visualizations, enabling farmers to track key metrics easily.
Workflow
1. Collecting Data from Sensors
Sensor data, such as soil moisture and temperature, is collected and sent to the server, where it is stored in a database. This data will be used to predict and manage farming conditions.
2. Processing and Predictions
The collected sensor data is processed using Python machine learning libraries. Here are some use cases:
-
Soil Moisture Prediction: Using past soil moisture data, a Linear Regression model from Scikit-Learn can be used to predict when to irrigate the farm.
from sklearn.linear_model import LinearRegression import numpy as np # Sensor data for soil moisture moisture_data = np.array([[1, 35], [2, 30], [3, 28], [4, 27], [5, 25]]) # [day, moisture level] X = moisture_data[:, 0].reshape(-1, 1) # day y = moisture_data[:, 1] # moisture level # Building a Linear Regression model model = LinearRegression() model.fit(X, y) # Predicting moisture level for the next day next_day = np.array([[6]]) # day 6 predicted_moisture = model.predict(next_day) print(f"Predicted soil moisture for day 6: {predicted_moisture[0]}%")- Disease Detection: Using TensorFlow or PyTorch, deep learning models can be trained to detect plant diseases from images of leaves or fruits captured by drones or installed cameras in the farm.
3. Displaying Results on a Dashboard
Once predictions are made, the data can be displayed on a dashboard for easy tracking and planning. The dashboard can show key information such as:
- Soil moisture levels in different areas of the farm
- Predictions for the best harvesting times
-
Alerts related to plant disease detection or unfavorable weather conditions
Example of creating a graph in a dashboard using Plotly Dash:
import dash
import dash_core_components as dcc
import dash_html_components as html
import plotly.graph_objs as go

app = dash.Dash(__name__)

# Graph data showing soil moisture levels
data = [
   go.Scatter(x=[1, 2, 3, 4, 5], y=[35, 30, 28, 27, 25], mode='lines+markers', name='Soil Moisture')
]

app.layout = html.Div(children=[
   html.H1('Durian Farm Dashboard'),
   dcc.Graph(
       id='soil-moisture-graph',
       figure={
           'data': data,
           'layout': go.Layout(title='Soil Moisture Over Time', xaxis={'title': 'Day'}, yaxis={'title': 'Moisture (%)'})
       }
   )
])

if __name__ == '__main__':
   app.run_server(debug=True)
4. Automated Alerts
The system can also send automated alerts, such as when soil moisture drops below a critical threshold or when temperatures exceed optimal levels. These alerts can be sent directly to the farmer’s smartphone for immediate action.
Use Case: Automated Irrigation Based on Soil Moisture Predictions
Mr. Somchai, a durian farmer in southern Thailand, experiences rapidly changing weather conditions. He installed soil moisture and temperature sensors throughout his farm. The sensor data is analyzed using a machine learning model that predicts when irrigation is needed to maintain optimal moisture levels.
Somchai can track the analysis on a dashboard via his smartphone, receiving alerts when it’s time to irrigate or when there are signs of adverse weather conditions that could harm the crops. This system helps him save time, reduce water wastage, and improve the quality of his durian yield.
Conclusion
By integrating IoT, machine learning, and dashboards, durian farming can become more efficient and data-driven. Farmers can control and predict various factors in the farm, reducing costs, increasing yield, and mitigating risks from environmental changes. This technology is a key enabler for the future of smart farming, allowing farmers to make precise decisions that enhance their operations.
Get in Touch with us
Related Posts
- 为什么我们选择设计 SOC Integrator,而不是直接进行 Tool-to-Tool 集成
- Why We Designed a SOC Integrator Instead of Direct Tool-to-Tool Connections
- 基于 OCPP 1.6 的 EV 充电平台构建 面向仪表盘、API 与真实充电桩的实战演示指南
- Building an OCPP 1.6 Charging Platform A Practical Demo Guide for API, Dashboard, and Real EV Stations
- 软件开发技能的演进(2026)
- Skill Evolution in Software Development (2026)
- Retro Tech Revival:从经典思想到可落地的产品创意
- Retro Tech Revival: From Nostalgia to Real Product Ideas
- SmartFarm Lite — 简单易用的离线农场记录应用
- OffGridOps — 面向真实现场的离线作业管理应用
- OffGridOps — Offline‑First Field Operations for the Real World
- SmartFarm Lite — Simple, Offline-First Farm Records in Your Pocket
- 基于启发式与新闻情绪的短期价格方向评估(Python)
- Estimating Short-Term Price Direction with Heuristics and News Sentiment (Python)
- Rust vs Python:AI 与大型系统时代的编程语言选择
- Rust vs Python: Choosing the Right Tool in the AI & Systems Era
- How Software Technology Can Help Chanthaburi Farmers Regain Control of Fruit Prices
- AI 如何帮助发现金融机会
- How AI Helps Predict Financial Opportunities
- 在 React Native 与移动应用中使用 ONNX 模型的方法


